MHA-Annual_Report-02.jpg

Corgan design corporate infographics

Brand Campaign, Brand Extension, Print and Web

Infographic design for corporate financial and organizational reports


Impact Statements, Data Snapshots, Survey Data Visualization


Infographics

MHA WESTCHESTER | ANNUAL IMPACT STATEMENT & EVENT PROGRAM

The mission of the Mental Health Association of Westchester is to promote mental health through advocacy, community education and direct services. Each year, MHA Westchester holds a fundraising gala to support their work throughout Westchester County, New York.


 In 2019, the MHA wanted to create a more friendly but elegant theme of “Celebration” both for their fundraising event and the impact report and event program.  While the cover had largely been settled, I took over the design of the primary collatera

In 2019, the MHA wanted to create a more friendly but elegant theme of “Celebration” both for their fundraising event and the impact report and event program.

While the cover had largely been settled, I took over the design of the primary collateral pieces, including the impact statement infographic and interior, as well as the event program. Using existing brand elements and the event slogo of “Caring Happens Here”, I developed a more sophisticated “evening out” look and feel by leveraging the brand’s dark blue as the main color to complement opposing clean white pages, and using gold and lighter blue more minimally as supporting accent colors. Key data figures were pulled out with large, expressive serif numbers separated by the use of ultra-thin grid lines.

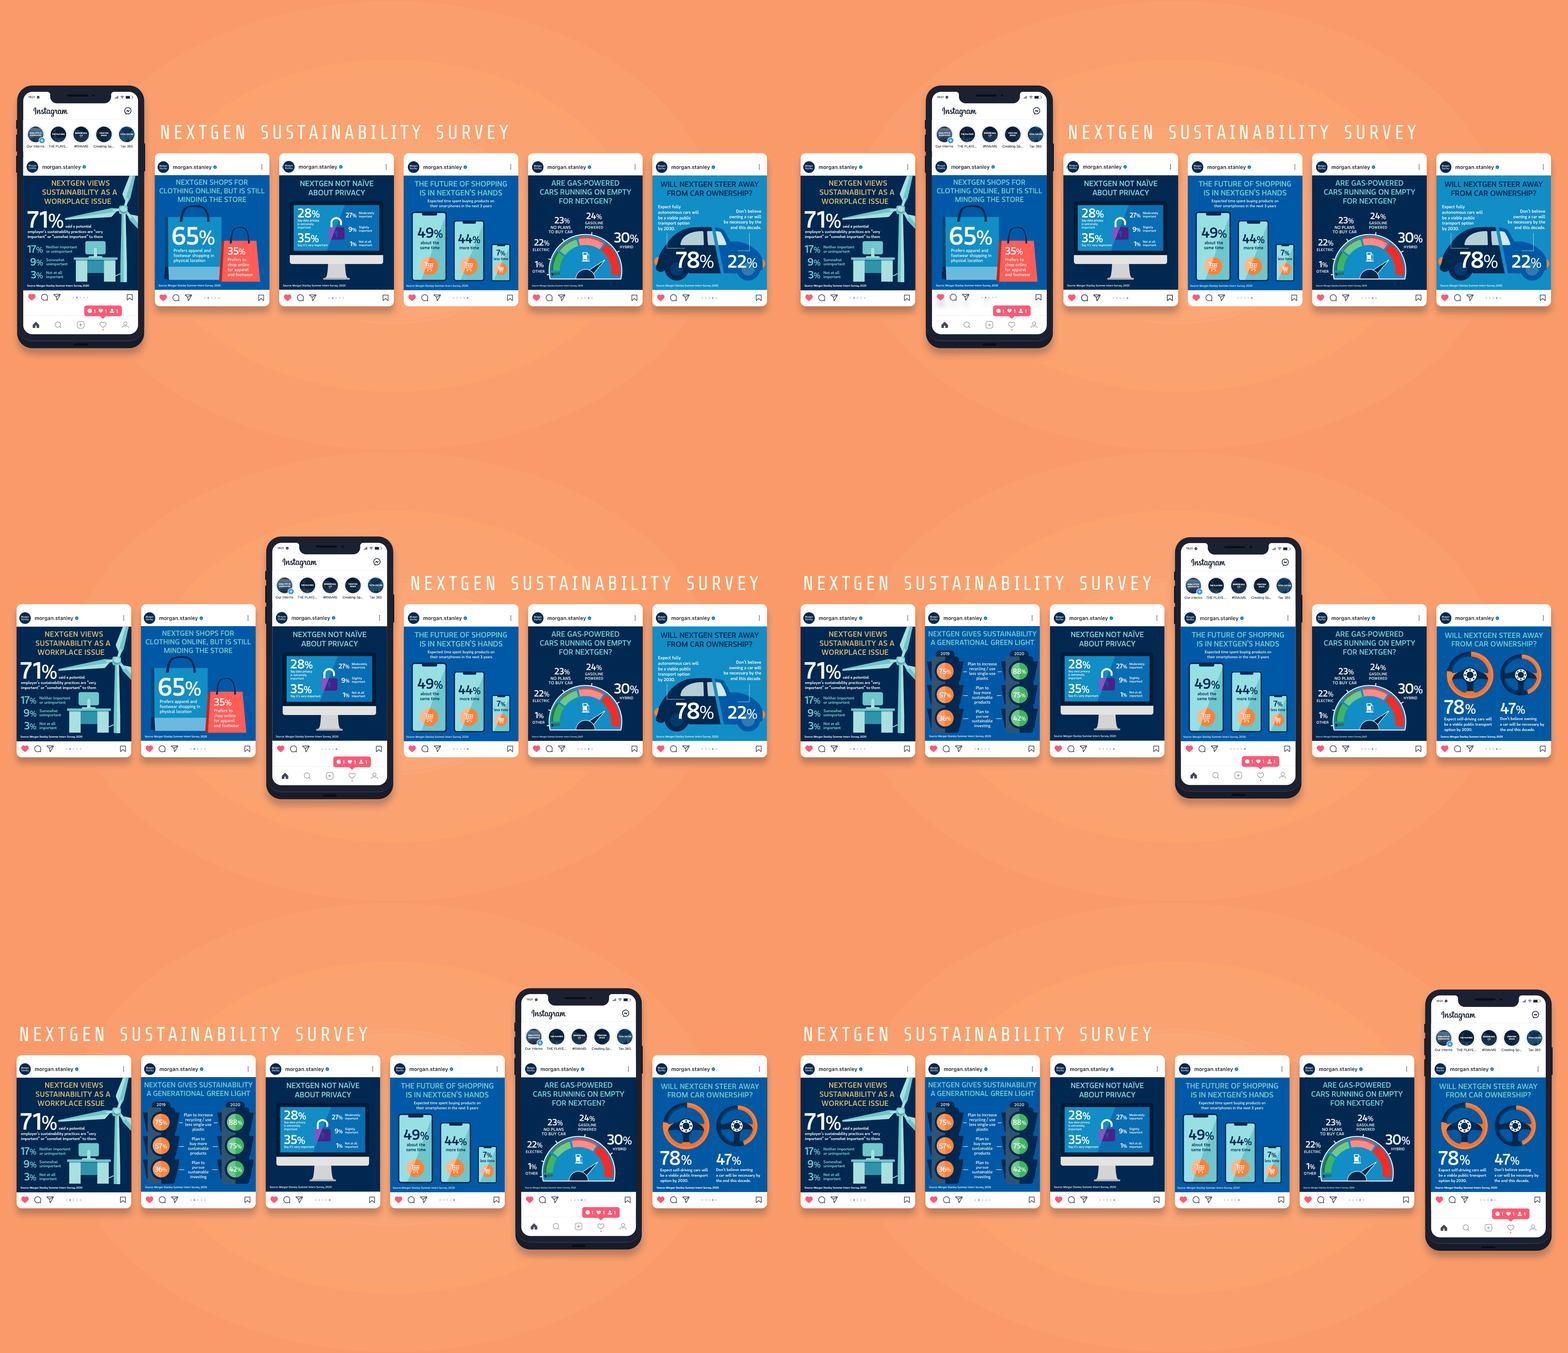
Morgan Stanley — Social Media Infographic series

Morgan Stanley — Social Media Infographic series

In the wake of taking temperature on priorities in the workplace, Morgan Stanley surveyed its incoming crop of interns on the importance of sustainability in the workplace. I was commissioned by their creative team to conceptualize and design a series of social cards to pair with each of the survey questions for a piece appearing on the Morgan Stanley website.

Financial Data for 8 Point Studio

Financial Data for 8 Point Studio

Under the creative direction of 8 Point Studio, I used raw benchmark content provided by the client to create additional new icons to the brand icon set, as well as design the layout for a series of financial fact sheet summaries.

 Leveraging the complimentary pairing of Miller, a classically confident serif in the brand typography toolkit, with clean icons treated with the brand accent color for a bit of pop, allowed an otherwise straightforward set of financial figures come

Leveraging the complimentary pairing of Miller, a classically confident serif in the brand typography toolkit, with clean icons treated with the brand accent color for a bit of pop, allowed an otherwise straightforward set of financial figures come to life.

Info-03.jpg
Visualizing Corporate Structure

Visualizing Corporate Structure

Infographic visualizing corporate restructuring for the client of a NY marketing firm.

Info-04.jpg